 By Soumya S. Dey, P.E., PMP; Benito O. Pérez, AICP; and Cliff Wickstrum
Big data is an evolving term that describes any voluminous amount of structured, semi-structured, or unstructured data that has the potential to be mined for valuable information. Although big data does not refer to any specific quantity, the term is often used when speaking about data sets so large or complex that they exceed the capacity “V”s: the extreme volume of data, the wide variety of types of data, the velocity at which the data must be processed, and the veracity of data.
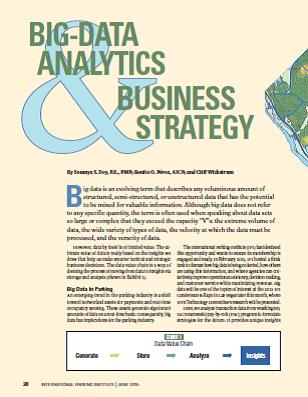
However, data by itself is of limited value. The ultimate value of data is really based on the insights we draw that help us make smarter tactical and strategic business decisions. The data value chain is a way of defining the process of moving from data to insights via storage and analysis (shown in Exhibit 1).
Big Data in Parking
An emerging trend in the parking industry is a shift toward networked assets for payments and real-time occupancy sensing. These assets generate significant amounts of data on a real-time basis. Consequently, big data has implications for the parking industry.
The International Parking Institute (IPI) has identified this opportunity and wants to ensure its membership is engaged and ready. In February 2015, IPI hosted a think tank to discuss how big data is being collected, how others are using this information, and where agencies can collectively improve operational efficiency, decision-making, and customer service while maximizing revenue. Big data will be one of the topics of interest at the 2015 IPI Conference & Expo in Las Vegas later this month, where IPI’s Technology Committee’s research will be presented.
Here, we analyze transaction data from Washington, D.C.’s successful pay-by-cell (PBC) program to formulate strategies for the future. It provides unique insights into the program, its customers, their usage patterns, etc. The analytics framework and approach will help other jurisdictions think about how they can look at their own parking data to gain deeper understanding of their systems.
Pay-by-Cell in D.C.
PBC was launched citywide in July 2011 to provide customers with an additional payment option at all 18,000 on-street metered curbside spaces. The program has reduced customer frustration associated with issues such as broken meters, having to carry change, and needing to return to the meter to extend a session. The District Department of Transportation (DDOT) selected Parkmobile as its PBC vendor after a competitive procurement process. The PBC program in the District has been very successful. Since its launch, PBC has accounted for more than 20 million transactions, has 900,000 customers, and accounts for approximately 55 percent of D.C.’s parking revenues.
PBC has a high level of customer satisfaction. Exhibit 2 shows that 95 percent of respondents in a customer service survey would use the system again and 86 percent would recommend PBC to someone else. Based on the question asked, 78 to 90 percent of respondents have a favorable view of the program. Anecdotal evidence, such as press articles, social media blogs, and Twitter also suggest a high favorability rating for PBC in the city.
D.C. is now seeing just more than 600,000 PBC transactions per month. The system-wide user and usage statistics have been documented.
A deep dive into the data revealed several interesting facts about PBC use in the District:
PBC user profiles are similar to traffic profiles in D.C. Thirty-one percent of PBC transactions are by vehicles registered in D.C. Vehicles registered in Virginia and Maryland each account for 28 percent of PBC transactions. The remaining 13 percent are by vehicles from the other 48 states. However, D.C. accounts for only 13 percent of the customer base, while Maryland and Virginia each account for 30 percent. This implies that on an average, D.C. vehicles use the system almost 2.5 times as much as Maryland and Virginia drivers. However, the average parking duration for D.C. drivers is lower: 55 percent of D.C. vehicles park for less than one hour, compared to 40 percent for Maryland and Virginia vehicles (shown in Exhibit 3).
There are three ways to initiate a parking transaction using the PBC program: via smartphone application, phone call, or online. Since the launch of the program, the percentage of parking transactions that are initiated through the smartphone app has increased steadily from 40 percent in 2011 to 90 percent now (shown in Exhibit 4). Phone calls using interactive voice recognition account for 8 percent of transactions while the remaining 2 percent are initiated using the web. This insight on user preference has implications on how parking and transportation services should be provided in the District.
There are three primary ways of scheduling payments using the program: credit/debit card, virtual wallet with pre-loaded value, and PayPal. Currently, 83 percent of transactions are made by credit card, 7 percent with wallet, and 10 percent via PayPal. Visitors and infrequent users have a higher usage rate for PayPal (12 percent), most likely because of the tool’s brand recognition and sense of security, while D.C. residents have a higher usage rate for wallet (10 percent), most likely because they initiate more transactions and can take advantage of the lower transaction fee.
Monday is the lowest activity day (60,000 transactions on average) followed by Saturday (66,000). Friday has the highest (80,000) average number of parking transactions. There is no significant difference in duration of parking (approximately 90 minutes) between different days of the week.
Starting Jan. 1, 2015, DDOT initiated a commercial loading zone program that required commercial vehicles in loading zones to either display an annual ($323 per year) or daily permit ($10 per day) or use PBC ($2 per hour). Since its inception, 67 companies and 588 vehicles have purchased the annual pass, and 10 vehicles have purchased the daily pass. On the PBC side, 9,523 distinct vehicles have used the system for 22,056 transactions. The top 4 percent of users account for 36 percent of transactions. The next 14 percent of users account for 56 percent, while the remaining 82 percent of commercial vehicles account for 8 percent. This is similar to trends observed with personal vehicles, where 20 percent of the users account for 60 percent of the transactions. The average loading duration is approximately one hour. As shown in Exhibit 5, approximately one-third of loading operations occur during the a.m. and p.m. peak hours. Exhibit 6 shows the distribution of commercial zone usage.
Business Strategies
From DDOT’s perspective, the cost structure of PBC is significantly less expensive than the other two revenue streams for parking (coin and credit cards, shown in Exhibit 7). Given D.C.’s price points and cost allocation process, the capital and operating cost of PBC is approximately 65 percent less than coin and 30 percent less than credit card. So there is a cost benefit to pushing customers from coin and credit payment to PBC payments.
Given this, it makes sense to analyze the data from the program and look for opportunities to further increase PBC penetration rates. Some of the strategies can encourage natural shifts; for others, DDOT can create an environment that encourages a specific kind of behavior:
Phased Removal of Meters. By locating areas that have a high PBC penetration, DDOT could look into removing meters from one side of the street. Exhibit 8 shows a heat map of high PBC penetration areas. Within these areas, specific block faces with high PBC usage were identified. Removing meters would reduce parking operations costs and incentivize further PBC adoption.
Transaction Fees. D.C.’s business model for PBC is to pass the entire cost of the program to customers. One strategy to increase penetration would be to change that cost-sharing option by absorbing some costs (such as credit card processing) or the entire cost of the program. Looking at the data on past behavior, it is clear that current PBC users are largely insensitive to this fee. In response to rising credit card processing costs, D.C. increased PBC transaction fees from $0.32 to $0.45 in October 2012. At that time, D.C. also began offering a virtual wallet option for customers—customers could load $20 on their accounts with a credit/debit card, and parking transactions would draw down from those accounts. Customers choosing the virtual wallet option have their transaction fee reduced to $0.30. As shown in Exhibit 9, the changes in transaction fees did not have an effect on transaction volumes. They also did not result in an overwhelming adoption of the virtual wallet option (currently at 7 percent of all transactions). This implies that the transaction fees, for the most part, are in the price inelastic zone and/or customers see value in the program to pay the additional fee.
Further Expand the Program. The District’s PBC program has matured and enjoys the highest adoption rate in the country. The program has been tweaked incrementally to respond to customer demands and external trends. To further expand coverage, DDOT will need to adapt the program to make it attractive to non-users as well. Big data analytics can help in this regard. DDOT has started the process of mapping the origins of PBC users based on vehicle registration data. A heat map can be developed to identify areas of the city where PBC users live. The balance will be areas that are not using the system. Data from various sources (such as census, vehicle usage, cell phone usage, economic activity, etc.) will be used to identify characteristics of non-users. Based on traits that emerge, a marketing strategy will be developed to make them aware of the program and to make the program fit their needs (to the extent possible). For example, the transaction fees that the current user base does not seem to mind may be more of an issue for the current non-user population. The program might need to be modified to be more inclusive of unbanked customers if that trait is identified as a barrier to adoption.
Allow Overstays. The PBC program currently allows a customer to start another parking session after the initial parking session has reached maximum parking duration in the zone. The system essentially mirrors the functionality of the meters on this issue. Customers choosing to start another session can still be ticketed for over-staying. Approximately 10 percent of PBC transactions involve users starting another transaction beyond the stated parking time restrictions. Sixty-seven percent of overstays were for vehicles registered in Maryland and Virginia; this behavior was more predominant during weekdays. There is a policy question on whether PBC should allow overstays or not allow patrons to start another parking session after the maximum allowable parking duration has been reached.
Cell Phone Applications. The fact that almost 90 percent of PBC transactions are being initiated through the smartphone application has implications on how DDOT as an agency provides services and interacts with its customers across other program areas. To respond to the popularity of smartphone apps, D.C. has developed an application called RideDC that provides transportation options in real time (bus, train, bikeshare, shared vehicle) and offers SeeClickFix to request city services, gradeDC to rate city agencies, and TOPS to request public space permits. In the parking arena, DDOT will provide real-time parking availability information to its customers as part of a performance parking pilot in the Chinatown/Penn Quarter area.
Summary and Conclusions
This article provides a high-level overview of how big data analytics can help formulate business and policy decisions. The analysis presented is primarily based on data from the parking ecosystem—more specifically, the PBC program. To further enhance the data value proposition, the analytics needs to draw data from other parts of the parking ecosystem (meters, enforcement, occupancy, etc.) and combine it with data from other systems, such as special events, weather, traffic, demographic, socioeconomic, sales, and land use, to get an even better understanding of the various cause-and- effect relationships.
As parking systems get more sophisticated, the opportunities of utilizing big data to make smart tactical, business, and policy decisions will increase. The process can be overwhelming, but one of the guiding principles behind data management and analytics should be whether the information helps improve operations by reducing cost, increasing uptime, or increasing customer satisfaction. Metrics that help make smart business and tactical decisions are metrics that are worth tracking. Big data analytics will enable DDOT to position its parking program as an innovative, forward leaning, data-driven program. Lessons learned will help DDOT continuously enhance its parking program in particular and the transportation system in general, and better align both with customer needs, technologies, and the agency’s priorities.
Authors’ note: The authors would like to acknowledge the contributions of DDOT student interns Amy Liang, Ohene Ofosu, and Negin Askarzadeh for their help in data analytics. Acknowledgements are also due to DDOT staff Stephanie Dock for her peer review of this article, and Laura Richards for her analysis on commercial loading zones.
Soumya S. Dey, PE, PMP, is director of research and technology transfer with the District Department of Transportation. He can be reached at soumya.dey@dc.gov.
Benito O. Pérez, AICP, is curbside management and operations planner with the District Department of Transportation. He can be reached at benito.perez@dc.gov.
Cliff Wickstrum is vice president, sales solutions, with Parkmobile, LLC. He can be reached at cliff.wickstrum@parkmobileglobal.com.
TPP-2015-06-Big Analytics & Business Strategy